 Sign In
 0 Items (
 Search


Glikson accidentally vindicates the skeptics
For a sentence, I almost think Dr Glikson gets it. Yes it’s a quantitative question: will we warm by half a measly degree or 3.5 degrees?  It’s not about the direct CO2 effect (all of one paltry degree by itself), it’s the feedbacks—the humidity, clouds, lapse rates and other factors that amplify (or not) the initial minor effect of carbon.
Decades ago, the catastrophe-crowd made guesses about the feedbacks—but they were wrong. Instead of amplifying carbon’s effect two-fold (or more!) the feedbacks dampen it.
Dr Glikson’s has no reply. He made no comment at all about Lindzen[i], Spencer[ii] or Douglass[iii] and their three peer reviewed, independent empirical papers that each show that the climate models are exaggerating the warming by a factor of six. (Six!) He’s probably unaware that the assumptions about positive feedback are wrong, and all the portents of disaster were built upon those guesses. Everything else is just an error cascade flowing from a base assumption that is implicit and essential (and wrong). Don’t expect the IPCC to explain it in an easy to read brochure though.
In Figure 2 of Glikson’s piece, he actually inadvertently demonstrates the missing hot spot. There’s the vindication. Glikson apparently doesn’t understand that the upper tropospheric graph is supposed to show a higher rate of warming than the surface graph. Instead it’s about the same. This is yet another way of showing there is no hotspot, no “thickening” of the global-greenhouse-gas-blanket, and thus that the surface warming is predominantly not caused by an increase in greenhouse gases.
As usual, everything else offered by Glikson depends on the flawed models, on cringe-worthy Hockey-sticks, or on studies from millions of years ago that don’t have the resolution to tell us much about cause and effect.
Who is confused here?
Glikson tries to paint me as confused and quotes out of context. When I ask for evidence that sheds light on a cause, I’m talking about all the evidence he was offering on sea ice, or ice sheets, or sea levels, which tell us nothing about what caused the warming. Glikson at least seems to agree with me, as this time (finally) he’s stopped repeating those irrelevant points.
Then he wonders about my statement about the cause and effect link being reversed in the ice cores and asks whether I question whether it is CO2 which drives temperatures. Absolutely! Hasn’t he heard of Le Chateliers Principle? It’s basic chemistry. The vast oceans have 50 times as much CO2 as the sky does, and the oceans release carbon as they warm and suck it back as they cool. This explains the tight correlation in the famous ice-core graph, and the 800 year lag (which is how long the deepest oceans currents take to circulate). The Vostok Ice cores definitively confirm that temperatures drive carbon. Carbon probably amplifies this warming somewhat, but there is no clear evidence in the ice cores that carbon does much at all. If there was, why would the Big Scare Campaign keep it a secret?
Digging up ancient evidence
This is Dr Glikson’s bread and butter topic. He claims the geologic record displays episodes of primary forcing from carbon, but where is the evidence? All Keller[iv] shows is that big volcanos seem to cause big extinctions. Is he serious? Volcano’s pump out massive CO2 (which warms the planet a bit) but they also pour out volumes of ash (think “nuclear winter”). Super volcano Toba was only 70,000 years ago, but if the effect was net warming, it doesn’t show in the ice core records. Indeed researchers argue about how cold it got and how long it lasted. Was it just a 3 °C fall over 1000 years or was it a 15 °C drop over just a few decades?
Zachos 2008[v] talks about the PETM 55 million years ago. He claims this shows methane warmed the planet, but Zacho’s hardly refers to methane. It’s a paper about CO2. Awkwardly, other researchers find that the carbon spike appears to have followed the temperature spike with a lag of around 3000 years[vi].
With Ward 2005[vii] the problem is that we can’t tell whether the carbon rose before the extinctions, or after. The odd 1000 year lag gets rather lost in the 250,000,000 year record. With this and the Geocarb graph[viii] Glikson assumes carbon causes the glaciation during the last 500 million years. But golly, we know that when temperatures are low, glaciers form and the oceans suck up all the CO2 they can find. It is no coincidence that low temperatures and low CO2 go together. It’s entirely expected and it tells us nothing about whether CO2 amplifies the temperature. At least one study suggests it was solar insolation that forced the icesheets to melt not CO2.[ix] This is not just a his-vs-hers assumption tit for tat. There’s a big difference: we know temperature definitely affects CO2 (as I mentioned previously), and we’re pretty sure (thanks to empirical evidence, see above) that CO2 only amplifies that warming by a minor amount. When in doubt, go with the known evidence, rather than the flawed models.
The big question is that if CO2 drives the climate, how come the only papers that supposedly support a major forcing come from eras so long ago that no one can say which factor rose first? Since temperature drives carbon we know there’ll be a correlation in the past. It’d be shocking if there wasn’t. But why o’ why is there no concrete evidence from the last million years?
Hokey hockey sticks
Dr Glikson still thinks the Hockey Sticks are worth mentioning—they’ll go down in history as a rank embarrassment to climate science, and to Nature and GRL (for publishing them). MBH 1999, as I mentioned in my last reply to Glikson, is so poor analytically that his technique generates hockey sticks even with random data. It’s a joke.
The IPCC graph Glikson provides “appears” to have independent studies, but 7 of the 10 studies include Mann, Briffa or Jones (each name is listed four times across these papers). Its not what the rest of the world calls “independent.”
Three studies depend on Bristlecones (which grow faster when CO2 is higher, making them totally unsuitable). Two rely on the Yamal series (which boils down to one tree in northern Russia being a freak 8-standard deviation tree in the 1990’s to give it a hockey stick—this is a tree that might have grown extra fast because, say, a bear died and rotted on its roots). Two other studies use both Bristlecones and Yamal. Eight of the studies are so flawed they are worthless.
The only other two studies use different series with their own flaws, one old Briffa series is out of date, another has a large manual adjustment, and Moberg et al, hides his data making it hard to replicate, and also depends on uncalibrated data. The Moberg graph is nothing like a Hockey Stick in any case.
When I say “warming started a century before our carbon emission rose” and point out that the warming trend hasn’t changed with all that extra CO2, Gliksons only response is debunked Hockey Sticks, and guesstimates from faulty climate models. Is that it?
Where’s the evidence?
The totality of “evidence” comes down to climate models that don’t agree with the observations and ever more ancient geological studies which may or may not show an effect but are simply unable to resolve details that we need. This is why the Michael Manns, Gavin Schmidts and Al Gores of the world won’t debate publicly. They know they’d get caned.
If Andrew Glikson thinks he serves the taxpayer by promoting the unproven hypothesis of AGW, he must first examine the models he refers too, and give the public a balanced view of the uncertainties. It’s time for the propaganda of half truths to stop. It’s time for universities to be called to order and shamed for their pathetic standards of logic and reason.
Figures:
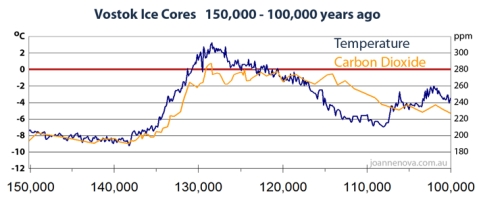
Figure 1. Vostok Ice Cores
Carbon clearly follows temperature in ice cores. There is an 800 year lag[x] on the rise, and several thousand years of lag on the fall. Temperatures drive carbon. Carbon probably amplifies this, but the effect is minor, and the amount can’t be calculated with any certainty from the Vostok data.
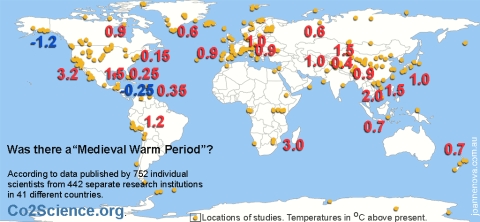
Figure 2. Evidence for the Medieval Warm Period
Hundreds of peer reviewed studies show it was warmer over most of the globe during medieval times. Over 6,000 boreholes from all over the world agree[xi]. Craig Loehle[xii] also combined 18 different proxies to arrive at a similar curve. The Hockey Stick is wrong.

Boreholes show it was warmer 700 years ago
[i] Lindzen, R. S., and Y.-S. Choi (2009), On the determination of climate feedbacks from ERBE data, Geophys. Res. Lett., 36, L16705, doi:10.1029/2009GL039628. Updated in pre-press for 2010.
[ii] Spencer, R.W., Braswell, W.D., Christy, J.R., Hnilo, J., 2007. Cloud and radiation budget changes associated with tropical intraseasonal oscillations. Geophysical Research Letters, 34.
[iii] Douglass, D.H., J.R. Christy, B.D. Pearson, and S.F. Singer. 2007. A comparison of tropical temperature trends with model predictions. International Journal of Climatology,
[iv] Keller, G. (2005). Impacts, volcanism and mass extinction: random coincidence or cause and effect? Australian Journal of Earth Science, 52/4, 725-757. [abstract] http://www.ingentaconnect.com/content/tandf/aes/2005/00000052/F0020004/art00020
[v] Zachos, J.C. 2008. “An early Cenozoic perspective on greenhouse warming and carbon-cycle dynamics” Nature 451, 279-283.
[vi] Sluijs 2007, Environmental precursors to rapid light carbon injection at the Palaeocene/Eocene boundary, Nature 450, 1218-1221 (20 December 2007) doi:10.1038/nature06400 [Abstract]
[vii] Ward 2005, Abrupt and Gradual Extinction Among Late Permian Land Vertebrates in the Karoo Basin, South Africa, Science Vol 307 4 February 2005
[viii] Graph of last 500 million years GEOCARB III ttp://quadrant.org.au/img/content/April%202010/Glikson%20Fig%202.bmp
[ix] Clark et al 2009 The Last Glacial Maximum, Science 7 August 2009:
Vol. 325. no. 5941, pp. 710 – 714
[x] Caillon, N., Severinghaus, J.P., Jouzel, J., Barnola, J.-M., Kang, J. and Lipenkov, V.Y. 2003. Timing of atmospheric CO2 and Antarctic temperature changes across Termination III. Science 299: 1728-1731.
[xi] Huang, S., H. N. Pollack, and P. Y. Shen (1997), Late Quaternary temperature changes seen in world‐wide continental heat flow measurements, Geophys. Res. Lett., 24(15), 1947–1950.
[xii] Loehle, C. and J.H. McCulloch. 2008. Correction to: A 2000-year global temperature reconstruction based on non-tree ring proxies. Energy and Environment, 19, 93-100.

