 Sign In
 0 Items (
 Search


A new study, conducted by lead author Ian McNaughton, formerly senior scientist at the UK Atomic Energy Authority, and John McRobert seeks to ascertain whether there is a meaningful relationship between carbon dioxide concentrations and global temperatures. The study, Temperature Measurements versus Population Growth & Carbon Dioxide Concentrations, completed in December 2023, examines the contentious claim, often made by climate change scientists, that the increase in temperatures of Planet Earth is determined by the increasing levels of carbon dioxide concentrations and other “green-house” gases.
Controversy involving climate change continues to be widespread throughout the world. There is no argument that the world’s climate is changing – always has, always will. The controversy centres on whether Carbon Dioxide (CO2) generated – actually recycled – by human activity is the cause of a more rapid change in climate that would not have occurred without the presence of humans, notably since the Industrial Revolution commencing in the late 1700s.
For decades, the scientific debate about the threat of rising global temperatures from increasing atmospheric carbon dioxide concentration has depended on estimation, the use of anomalies rather than actual and complex computer modelling of key variables. The complexity of these calculations and reliability of the result are seen in the widely variable (and always above actual outcomes) predictive models. The rising CO2 concentration in the atmosphere and rising surface temperatures as used by these calculations indicate a strong positive correlation, and modelling extrapolation of this relationship into the future shows alarming, exaggerated increases in global temperatures leading to widespread concern about ‘global warming’. Not unexpectedly, this has created a demand by the public for urgent action by governments to significantly reduce the concentration of atmospheric CO2 at a global level.
In stark contrast, McNaughton’s study is based on a simpler approach restricted to actual data from several sites, and using only basic computations, mainly graphical, to determine the relationship between the key variables in the debate. That data, covering temperature, CO2 concentration and population size and growth sourced from various websites, was not modified, homogenised, or adjusted in any way, hence the graphs that form the basis of this study, directly reflect their actual values and variations.
Furthermore, it was not the purpose of the study to discuss how changes in complex local, global, and cosmic processes over long periods of geological time influence the weather except to note that they do, as reflected in the glacial – interglacial record from ice cores. Instead, this study focussed on the outcome of the combined effects of these processes in terms of temperature levels and CO2 concentrations, presented in graphical form with extrapolations to provide an indication of what values they are likely to take in the future.
Initially, key temperature measurements were taken from those made at a meteorological station located at Observatory Hill in the inner-city Sydney suburb of Millers Point, close to the CBD. This site was chosen since the temperature variations measured there were assumed to be typical of most of the major cities in the world that shared common environmental factors such as population size and growth, industrial processes, and numbers of motor vehicles.
For comparison purposes, temperature measurements were also sourced from five other cities/regions located around the world: Central England, Bangkok, Sacramento-San Francisco, Autauga County (US), and Massachusetts. Global measurements of CO2 accepted by scientists were chosen on the assumption they were common to all meteorological stations around the world.
Analysis of the trends of CO2 concentration, population growth and temperature, showed that, although there is a visible relationship between population growth and increases in the concentration of atmospheric CO2, there is little or no visible relationship between increases in CO2 concentration and temperature for the six sites examined, and by inference, globally. This assertion is based on the following graph of the measurements recorded in Sydney where the variations are typical of all the other sites analysed. The graph clearly shows the independence of temperature variations from the increasing concentrations of CO2:
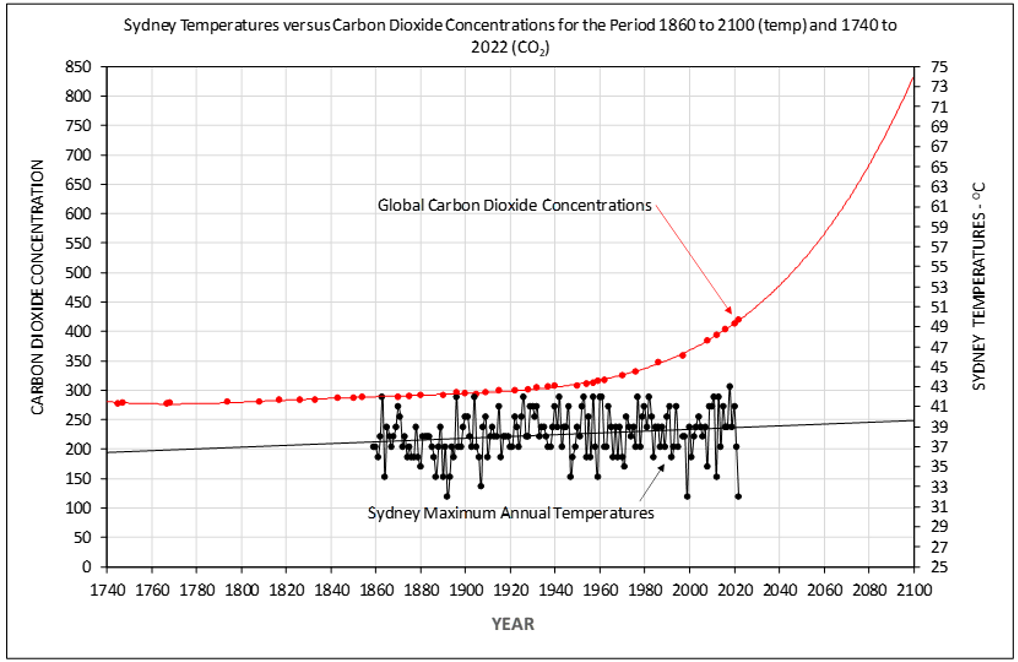
The study reveals that temperatures are influenced mostly, if not entirely, by the ever-present local, global, and cosmic forces that have affected temperatures throughout geological time. This suggests that, regardless of what action the world takes to reduce or eliminate future increases in CO2 concentrations, global temperatures will continue to vary (as shown) in line with local, global, and cosmic processes, independent from the concentration of CO2 in the atmosphere.
The temperature and CO2 data from the six separate sites were processed using Microsoft EXCEL. Best-Fit (or Trend-Lines) for the above variables were added to each graph. In the case of temperatures, the optimal Trend Lines were linear. For the CO2 and Population graphs, the best fits were polynomials – a 4th degree polynomial for CO2 and a 2nd degree polynomial for Sydney population.
The Trend Lines are seen to be excellent representations of the changes over time for each of the variables, and closely match the actual recorded values of CO2 concentration and temperature data from the six sources. Each Trend Line was extrapolated backwards to 1740, and forwards to 2100. The year 1740 was chosen as closest to the lower limits of useful data; the year 2100 was chosen as a date common in current discussions of climate change.
The graphs allowed the levels of temperatures for the next few decades to be predicted with reasonable accuracy because the observable variations of temperature at the chosen sites have been consistent for well over a century, even during the later years (1980s and beyond) when the concentration of CO2 accelerated beyond the rates observed for the earlier period, 1740 to 1940. The concentration of CO2 is also totally dependent on volcanic activity when it occurs. The 1815 Tambora eruption resulted in the following ‘year without a summer’ and the more recent Mt Pinatubo eruption in the Philippines in 1991 lowered global surface temperatures by approximately 1C for about a year.
In summary, the graphs showed that temperature averaged for all the sites examined is currently increasing at an approximate rate of 0.01oC per year, or just under 1.00oC for every 100 years. There is no graphical indication in all the locations examined that the increasing concentrations of CO2 in the atmosphere had any impact on temperature variations. The inference is that this trend is not just local, but global as well.
In conclusion, the relationship between increasing global concentrations of CO2 and increasing global temperatures for the six sites studied has been shown to be tenuous at least, and most likely, absent. It suggests that the increasing concentrations of global atmospheric CO2, regardless of its sources, should no longer be of global concern to humanity now and into the future.
However, solutions to enable the world’s population to live comfortably with the inevitable increase in temperature resulting from local, global, and cosmic processes, need to be determined since there is nothing humanity can do to stop the increases. Based on this study’s predictions, these solutions do not include regulation of human recycling of CO2, and there is ample time to determine exactly what they will be. In the meantime, money and resources currently being wasted on inefficient methods of harnessing energy would be far better spent in hardening our infrastructures with flood-mitigation, water-capture-and-storage, fire-proofing houses in the outback, drought-proofing and building cyclone resistant ports, and dependable coal-fired power stations and hopefully, nuclear power stations. So-called and deceptively named carbon-capture-and-storage (really meaning CO2 capture and storage) is a dreadful waste of resources when life on Earth needs this valuable heavier-than-air, non-polluting plant nutrient to flow freely in the forests.
McNaughton’s study reveals that there is no climate emergency, just a man-made political weapon polluting the minds of the ill-informed and gullible, and allowing politicians and others to pursue their not-so-hidden agendas.
Gabriël Moens AM is an emeritus professor of law at the University of Queensland and served as pro vice-chancellor and dean at Murdoch University. In 2003, Moens was awarded the Australian Centenary Medal by the prime minister for services to education. He is the co-author of The Unlucky Country (Locke Press)
Ian L. K. McNaughton (now retired) was a physicist, mathematician & IT Manager. His experience includes measurement of cosmic rays in the Antarctic. He served as a Senior Scientist at the United Kingdom Atomic Energy Authority, Winfrith, Dorset.
John McRobert is a civil engineer with over 60 years’ experience in the design, construction and maintenance of major infrastructure, and the study of extreme natural events on man-made structures. He founded CopyRight Publishing in 1987 to facilitate informed debate, publishing over 200 books, including seminal volumes by geologists and engineers on major Earth seismic events

The disconnection between historical temperatures and CO2 partial pressure over the past century is well known to anyone who has spent a few minutes looking into the AGW ‘Science’ (TM). The reflected long wave radiation simply doesn’t energise the oceans: end of story. I guess it’s a bit like plugging a torch battery into your house.
Where can I find a copy of this study. It needs to be seen by as many people as possible.
Thanks Gabriel, very interesting.
These things can change of course ; computers however accurate and sophisticated the data can never really account for lacunas and unexplainable aberrations in trends, e.g. the last time I checked, the University of Alabama Huntsville’s lower troposphere anomaly temperature baseline showed no linear warming trend from april 2012 to april 2013 in Australia. Thats 11 years with not even 0.01 degrees per year, with no real explaination…… I wonder how the computer can possibly include that sort of thing in it’s computations ?
Looks like summative temperature records show a random walk, just like the Random Walk down Wall Street.. Ex-post facto we can compute ‘trends’ but they are computed retrospectively, and just like in the stock-market, are not a sound basis for future projections., let alone extrapolations by decades.
“the last time I checked, the University of Alabama Huntsville’s lower troposphere anomaly temperature baseline showed no linear warming trend from april 2012 to april 2013 in Australia. Thats 11 years with not even 0.01 degrees per year,”
Do you mean 2012-2023?
Marxist inspired nanny government relentlessly intrudes into every aspect of our lives in order to oversee life’s journey from cradle to grave. Even after we fall off our mortal coil the nanny state will be speculating on the amount of CO₂ our bodies will contribute to the government’s environmental scheme of things nonsensical. I would like to see Minister For Climate Change And Energy Chris Bowen, publically, on national television, undergo a Performance Review where, as part of the review, he has to draw a schematic of the Carbon Cycle, then explain the process of Photosynthesis and its role in the cycle. How would he perform? Would he get a passing grade?
Not a chance. Bowen has no intrinsic knowledge of biology or its ramifications, with the physics of climate, logarithmic correlations, and their myriad uncertainties way beyond him.
Only just noticed. I meant of course 2023 not 2013.
I agree with the authors calculations and conclusions, but perhaps there is a simpler way of looking at the issue. My preferred method is to view CO2 as a greenhouse gas (which it is) and when we do we see that it is only an insignificant one which makes up only between 1%-2% of all the greenhouse gases resident in the atmosphere (20,000 – 40,000 ppm of water vapour vs 416 ppm of CO2). By contrast, water vapour (humidity) makes up around 95% – 97% of all the greenhouse gases resident in the atmosphere and absorbs a similar range of solar radiation to that of CO2.
To that can be added the fact that of all the CO2 in the atmosphere, only 3% – 4% comes from human activity and they know this because CO2 that has been delivered into the atmosphere via the process of combustion (e.g. burning coal) has a different isotope to CO2 released for example by gas exchange with the oceans. However, not all the CO2 carrying this isotope comes from human actions, as events like geothermal activity and bushfires release CO2 with the same isotope as that released from burnt coal. Therefore human derived CO2 in the atmosphere is likely no more than 1% – 2% of all the CO2 present in the atmosphere. These are the figures supplied in the IPCC COP reports which have been available since 2002.
Combining all these things, how could it be logically or physically possible for an insignificant greenhouse gas of which an insignificant proportion is provided from, human activity, have any measurable effect on the climate when all those other greenhouse gases in much greater abundance have no effect?
This whole climate theory is just quite illogical and confused and is only possible because the various proclaimers of the theory are siloed from each other and no-one ever looks at the big picture as a whole..
I googled the title of the paper, with quotation marks and without, and also, for good measure, substituting “and” for the ampersand; could find no reference to it whatsoever, apart from a reference to it in this Quadrant article and an article in the Spectator by the same authors. Perhaps the paper has not been published yet (and as they say, good luck with that). Or, equally dispiritingly, has Google put it down the memory hole?
Unfortunately there is nothing new here. There is no doubting the truth of it to me. This article says what has been said by many a wise head for over a decade. John Christie, Judith Curry, Ross McKitrick. Richard Lindzen and many others all with first class academic credentials. All of these great folk have been damned as “deniers” by the vast Climate Hustler machine and their cohorts of useful idiots. The bull dust has a pretty much unstoppable momentum.
I am reminded of a quote from Jonathon Swift, “It is useless to attempt to reason a man out of a thing he was never reasoned into.”
The Sydney graph is interesting. But why are we not shown the data from the other 6 sites??
Sailing under the Sydney Harbour bridge in 1953 my father took a photo of a rainbow and Observatory Hill; covered in trees and grass.
Here is a picture of it recently with adjacent tar sealed road.
https://joannenova.com.au/2023/02/experts-bom-excuses-about-a-solar-panel-leaning-on-bushes-near-sydneys-official-thermometer/
I find it difficult to understand how the raw figures for this site could not have risen because of the immense development of the City of Sydney since ’53.
Its called the UHI effect.
Perhaps its because its right next to a large body of water called Sydney Harbour.
However to calculate the Global Average Surface Temperature you must need more than 6 readings.
The satellites show that the Troposphere is warming.
If you match that against the bigger data dump from satellites of temperature rise,
https://i0.wp.com/www.drroyspencer.com/wp-content/uploads/UAH_LT_1979_thru_February_2024_v6_20x9.jpg?ssl=1
the above conclusions may be correct, however not because of the argument.