 Sign In
 0 Items (
 Search


A postscript to “BOM loses rainfall”
The prime lesson to be drawn from the changing rainfall record in the Murray-Darling Basin is the inherent uncertainty of the rainfall estimates over any area of the country. But there is a sting in the tail.
The explanation for the variations in rainfall record is simple. A new method of creating the estimate has been developed and applied. This is not well advertised but the method is described in a published paper. The variations from the records ending in 2007, 2008 and 2009 are of the order of 20 mm per year against an average yearly rainfall of 480 mm for the years after 1948, an uncertainty of 4%. This will be compounded by the sampling process of rain gauges that cannot possibly capture all the local variations of rainfall. The use of satellite detection should better define spatial distribution but the measure of rainfall remains problematic. So the 4% uncertainty may be an under-estimate.
This new analysis has been carried out by the usual suspects, the CSIRO and the BoM along with the Bureau of Rural Sciences.
What is really intriguing though is the corrections made to the rainfall record tend to reduce the rainfall in the last half of the twentieth century. This is important since our projected future is for a hotter climate and less rain. An example of this is a quote from a paper Climate change and water use of native vegetation by Cate Macinnis-Ng and Derek Eamus, University of Technology, Sydney (2009), apparently commissioned by Land & Water Australia, that concludes:
Climate change will cause hotter, drier conditions with less rainfall across the majority of the Australian continent.
This is the received wisdom based on computer modeling but do the rainfall measurements compiled by the BoM point in this direction with decreasing rainfall as the Australian temperature record shows an increasing temperature?
Unfortunately they do not. The BoM adjustments to the 110 year record have brought the decadel increase in rainfall down from 5.4 +/- 3.4 mm per decade to 3.3 +/- 3.2 mm per decade. In fact the dominant feature of the record is the random behaviour of the annual rainfall with a scatter of up to 200 mm either way about the annual average of 470 mm.
This new value of the increasing rainfall is not significantly different from no increase over the century but it does not support any alarmist view of a devastating trend to drier times in the Murray-Darling Basin.
However by looking at the summer and winter months separately a more detailed story emerges: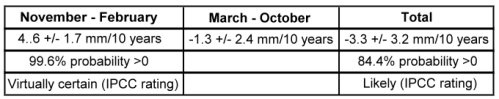
The statistical probability of the summer increase moves the confidence level from the annual analysis of “likely” to the “virtually certain” category of the IPCC ratings!
The data show that the temperature and rainfall both increased during the 20th century. So much for the received wisdom based on computer modeling.
Just as rainfall increased as Earth warmed markedly from the glacial epoch of 20,000 years, it appears that we might expect more rain in this region if the planet continues to warm. But what does this say about the regional modeling of climate? The recent Royal Society report underscores the uncertainty of model predictions at the regional level, a viewpoint borne out by the divergence of real trends and model predictions for the Murray-Darling Basin.
See also: “BOM loses rainfall” here

