 Sign In
 0 Items (
 Search


The splendiferous east coast of Tasmania never ceases to please with all its myriad landscapes. So it was a little discombobulating to recently pass a sign planted hard against the flow of traffic following the serpentine track that threads the coastal communities, proclaiming ‘Climate Change Is Killing the Planet’. As it was only about eight degrees at the time, I was reasonably confident I would make my destination before something akin to the fate of the death star transpired and, thankfully, I was right.
It did however get me to thinking how corrupt the science of the carbon cycle has truly become in the hyperbolic atmosphere of climate politics. You would likely need a temperature increase in excess of 100 degrees in order to extinguish all life, including prokaryotes, from the biosphere — and even then creatures at depth, both aquatic and terrestrial, would probably find safe harbour. Not to disappoint my sign-erecting fellow Taswegian, but his or her prophecy can’t possibly be achieved through carbon emissions alone. Furthermore, the complete death of the planet, depending on how you might define that, may require extinguishing all its iron and siliceous substrate into stardust, a mighty feat even for that arch villain, CO2.
Wishing to stay open minded about what 400 parts per million of carbon dioxide had inflicted on the planet, I was intrigued when it was announced recently that what has been a great example of citizen science orchestrated under the banner of the Antarctic Climate & Ecosystems Cooperative Research Centre (ACECRC) was to be more or less abandoned, possibly due to being unhelpful to the narrative that accompanies climate change dogma. Known as TASMARC (Tasmanian Shoreline Monitoring & Archiving Project), this admirable public access project, 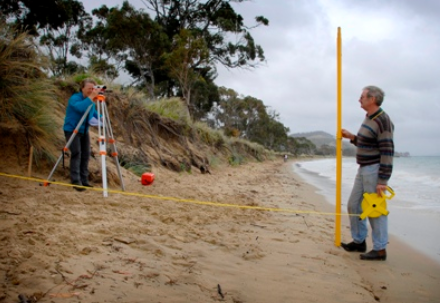 with dedicated volunteers at the dune face of data collection, commenced tracking the gradient of 16 beaches around the Apple Isle in 2005, the object being to measure ‘the shoreline and the way it is responding to storm events and sea-level rise. Utilising standard surveying equipment (as depicted at right) employed by engineers in civil construction projects and the like, over the course of the project the number of sites measured and profiled expanded to thirty.
Without putting too fine a point on it, there is no possible way the resultant data can be manipulated to demonstrate anything other than “nothing to see here” in regard to supporting the notion of CO2-mediated sea level rise. Right around the diverse coastline of my island state the consolidated picture revealed over 15 years is one of cyclic erosion and beach regeneration, from low water mark to high water mark and into the fore dunes. In the period from 2005 through 2019 the general picture is of increased erosion in outlying years around much of the coast and increased regeneration, often to peak maximum sand accumulation, with resultant decrease in profile gradient in the terminal years of the project. Nowhere in the data is there compelling evidence, not even a scintilla, of uniform sea level rise. If anything the data points to a gentle retraction of sea level and associated severe storm events affecting the bulk of the coastline surveyed in recent years.
Below is data from half a dozen sites taken from the differing aligned coastlines that define the rough triangle that is Tasmania. Think of each plot line as a cross section of the gradient of the beach from fore dune to water’s edge, exaggerated by the fact that the unit divisions on the X & Y axis are a ratio of 20:1. Note that the terminal end of the plot lines along the far right of the X axis is simply a reflection of where in the tidal phase the measurement was recorded. Any change in sea level would see the plot lines migrate left along the x axis over time, a trend that is clearly absent in this data.

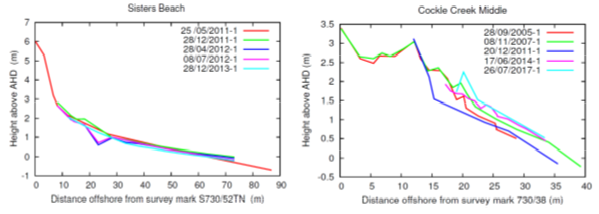
Image 1. Selection of TASMARC beach gradient plots.
With claims now emanating from CO2 catastrophists that the world has just 12 years to act before catastrophic climate change destroys all life on earth — Hobart’s City Council has declared a climate emergency no less — it is becoming patently clear that politics has left behind any rational appraisal of the science in order to turn the bogeyman of CO2 into a Trojan horse for the radical hijacking of modern capitalist economies. Back at over 400ppm of CO2 in the atmosphere (the planet has been there before) and up from the 260-330ppm that marked the last ice age (but way down on the much higher levels of the Ordovician ice ages), not an iota of evidence from the commendable science conducted by TASMARC suggests sea level have risen or are rising, least of all to the peril of all living creatures. This pleasing result accords with my own experience of inshore reef systems in Samoa, Fiji, Sumbawa and Sri Lanka in recent years, none of which demonstrated any alteration whatsoever to the inter-tidal zone of the near-shore reefs, which have quite clearly remained within discernible parameters for hundreds, if not thousands, of years.
It is accepted that sea levels vary markedly around the globe and fluctuate dynamically, both through relatively short-lived and longer phases, leading to what is in effect a ‘lumpy’ ocean. This reality makes the concept of a static mean sea level, which acts as a reference benchmark for the globe as a whole, very problematic. Numerous satellites utilised by Australian agencies and research bodies are able to take a measure of sea level by way of an altimeter. However, according to the CSIRO, it should not be overlooked that the signal to do so requires
# A satellite in an orbit which repeats the same ground track very closely (within about 1 kilometre)
# A radar system to measure the distance from the satellite to the sea surface to high accuracy. TOPEX/Poseidon and Jason-1 use two radar frequencies, Ku band (13.6GHz) and C band (5.3Ghz).
# A tracking system capable of locating the satellite vertically at any time to within a few centimetres. Some of the components of such a system are:
1/ Systems (usually a combination of GPS, satellite laser ranging and the French DORIS system) to locate the satellite
2/ A high quality gravity model
3/ A model of the drag from solar wind and the atmosphere
4/ Suitable software to combine all of the above
Other corrections to correct the range:
On the satellite:
1/ A water vapour radiometer to measure the amount of water vapour between the satellite and the sea surface (the water vapour slows down the radar pulse, causing the raw measurement to be too long)
2/ Measurement of the range at two frequencies to estimate the “ionospheric correction” — that is, the degree to which the radar pulse is slowed down by free electrons in the ionosphere
3/ The troughs of waves contribute more to the radar reflection than the crests, so we need a corection for this. This is estimated from the wind speed and the wave height, both of which can be estimated from the characteristics of the returned radar pulse.
On the ground:
1/ Ocean tide models to convert the raw altimeter measurement to “de-tided”
2/ Estimates (from a model) of the atmospheric pressure. This is used to calculate a correction to the radar range to compensate for the atmosphere slowing down the radar pulse
3/ A correction for the “inverse barometer” effect, where sea level is depressed in areas of high atmospheric pressure, and vice versa.
No one besmirches the accomplishments of the engineering and technology involved. However, it is a basic truism that the greater the number of separate corrections needing to be applied, the greater the risk of miscalculation. Ultimately, the lived experience as manifest through the empirical evidence of what is actually occurring at the shoreline and observed over time is a truer reflection of reality than the highly manipulated data required for a satellite altimeter to operate meaningfully. This should be especially true of the Australian continent as a whole, which although obviously susceptible to localised subsidence, is largely stable in relation to the confounding factors of tectonic activity and post-glacial rebound. Thankfully, these measurements are regularly recorded around Australia by the BoM via tide gauges. So an exercise in comparing them is illuminating.
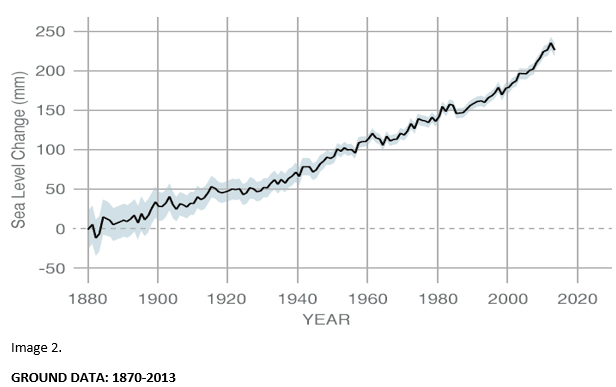
It is of interest to see NASA reference the CSIRO for its public online depiction of sea level rises in the order of 24cms from around 1880s until now, as determined by tide gauges. This is in the context of a sea level rise in the order of 50 – 120 metres since the last ice age. It is unclear how the CSIRO arrive at this aggregated figure, given the vast geographic spread of all the individual data sets. On first blush, satellite and ocean-temperature data suggest a neat fit in correlation to where the ocean has both warmed the most and exhibits a higher sea level. The CSIRO models suggest that since 2005, when the TASMARC study also commenced, the east coast of Tasmania, along with that of NSW, has experienced sea level rise in the order of 10 – 15mm per annum.
If applied throughout the period of TASMARC observation along Tasmania’s east coast, then a significant rise in order of 14 – 21cms should have been observed.
Fort Denison in Sydney Harbour has registered a mean sea level rise of no greater than 10cms in 115 years and this might be due to subsidence or even increased water displacement by large volumes of very heavy vessels in and around the site and significant waterside developments such as the Opera House. Just down the road at Botany Bay the mean sea level has barely varied at all since 1982, the most significant departure from mean being a decrease during the mid 1990s. Further afield, and also since 1982, Eden on the NSW south coast has witnessed barely a nudge on the dial, while Lord Howe Island looks to have escaped the ravages of sea level rise altogether since 1993 — this despite being at the epicentre of the CSIRO’s historic sea level rise model. Indeed, there does not appear to be a single data set which comes even close to explaining the mean sea level rise observed in the consolidated graph as supplied by the CSIRO to NASA.
The only site in Australia that can seemingly approximate the values in the NASA-published graph above is the oft-cited example of the Isle of the Dead at Port Arthur in Tasmania. Given that the data from this site is an extreme outlier in the bell curve of mean results from other Australian, and even Tasmanian, sites should ensure a degree of caution is applied in holding it up as a poster child — an academic caution that has well and truly been abandoned in this instance. However, the problematic nature of this site’s data set and overall lack of clear evidence for sea level rise was highlighted by the late Tasmanian John Daly (see: https://www.aph.gov.au/Parliamentary_Business/Committees/Joint/Completed_Inquiries/jsct/kyoto/sub44c) during the early years of this century. Daly would have felt himself vindicated by the ongoing lack of convincing data trends over the ensuing years.
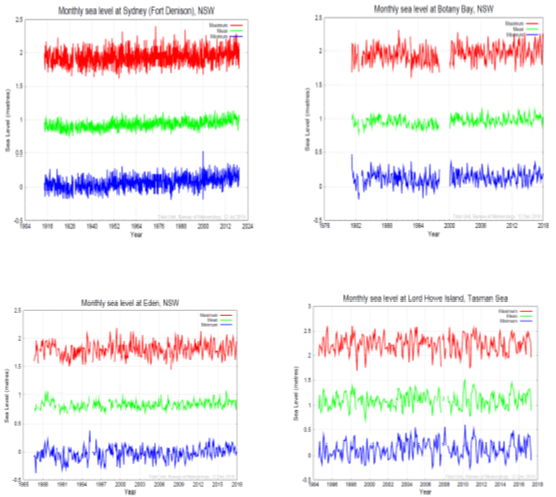
Image 3. Graphs from BoM tidal gauges

Image 4. CSIRO heat map of historic sea level rise.
It is clear there is a notable disparity between the data from the above sea level rise heat map, satellite readings and the real-world empirical data collected at the coastline. What should be most alarming to those climate scientists who remain committed to the principles of science, sadly diminishing in number, is that the above empirical evidence will be quietly shelved and discarded in favour of deeply flawed predictive models that whip catastrophists and a sympathetic mainstream media into a frenzy despite being wrong time and time again. As a keen surfer I was alarmed to learn in my youth that the Maldives would by now be fully immersed in the Indian Ocean. Fortunately, that thirty-year prediction from the early 1990’s looks to be just another deranged moment in the long history of doomsday predictions.
The Permanent Service for Mean Sea Level (PMSL), operated by the UK’s National Oceanographic Centre, uses a select assortment of both acoustic pressure gauges and your more run-of-the-mill tide gauges from around the globe to assess mean sea levels. The data sites currently operating around the world as part of the PMSL project (many no longer provide data, or have not done so for a number of years), may look impressive on first sight, but it quickly becomes evident that they are utterly deficient to give a global average in sea level, as there are significant fields of concentrated activity recorded and others with little detailed coverage. The only data from Australia’s eastern seaboard to feature on a relative sea level trend map is Fort Denison. Overall, the PMSL data reveals relative sea level trends of both rising and falling sea levels in different parts of the globe. The trend data map qualifies that
The map should be used with some care as anomalous trends have many causes:
1/ land movements (e.g. earthquakes, glacial isostatic adjustment)
2/ unexplained instrumental datum shifts
3/ changes in atmospheric pressure
4/ short records
While climate change alarmists love to wheel out their version of an uncritical weaponised ‘science’ to bash all non-believers, the truth is their quasi-religious zealotry in advocating faith in CO2’s influence on climate bring dishonour to the very concept of science itself. The fact of the matter is that scientific enquiry covers a very large spectrum indeed, with the most rigorous represented by such methodologies as the double blind, placebo-controlled trial, as seen in medical science right through to the rather inferior suppositions that represent climate models’ predictions twenty, thirty and a hundred years hence. This kind of science should ring the sceptic alarm bell in any well-grounded critical thinker.
So blinkered has this politicised branch of science become that its priests and disciples cannot even effectively explain the role of CO2 in the context of the climate’s primary drivers — factors such as solar activity and the earth’s obliquity, which have now fallen off the radar in public discourse on climate. We now have the media, the education system and, hence our kids, telling us that CO2 in the atmosphere is “a pollutant”. Even the terminology – “climate change” – presumes a rigidly static climate is normal.
Those who believe all science is a linear progression of knowledge without significant departure into the realm of the ‘false positive’ hypothesis should think again. We have just emerged from decades of consensus science on the seemingly critical role of anti-oxidants in the combat of run away free radical oxygen species in the human body, only to realise now that much of it was poor science garnished with large dollops of hyperbole. As with climate science, the amount of wasted money, and the unnecessary anxiety as a result, is incalculable.
The results of studies such as TASMARC and so many others (eg: Kench et al, who published in 2018 the finding that Pacific islands such as Tuvalu are actually increasing, not shrinking at all) should act as a clarion call to the real climate scientists out there to turn away from the monomaniacal adherence to CO2-induced climate change; rather, climatological orthodoxy needs to re-survey the broader horizon of inquiry around all the drivers of climate and sea-level fluctuation.
I, for one, will be encouraging my children not to march against CO2 with their uncritical peers but rather to protest the doomsday alarmists who seek to add the notional threat of catastrophic sea level rise to the burdens of what is widely accepted to be the most anxious and depressed generation in recorded history — a generation whose educators have betrayed them by shepherding our schools’ retreat from the tenets of critical thinking, replacing it with intellectually crass and emotive advocacy learning.
The most irresponsible adults of our age are those who happily accept the elderly shivering through cruel winters in homes made too expensive to heat, likewise indifferent to industry’s needs, job creation and growth of the nation’s wealth being stymied. These are the same true believers who advocate the runaway use of lithium in so-called renewable energy applications, dismissing this century’s poisonous “new lead (Pb)”. Their children and ours are growing up thinking behind the veil of their anti-depressants that CO2 is an atmospheric pollutant that will ‘kill the planet’. It is they our children should be raging in the streets against.

JW,
Thank you for this article on sea level change, a topic I have followed for many years, with conclusions entirely similar to yours. As a minor addition to your comments on free radicals and antioxidants, in 2006 I had an essay in the Australian magazine “The Skeptic”, deploring the poor science that these chemicals had attracted art nutrition. I mention that 2005 event here because I have seen no mention of the article by anyone else. The mind foams to the movie “The loneliness of the long distance runner.”
However, compliments are here given to you to you for your words about sea level change. Geoff S
Compliments on a great article. As someone who lacks expertise in this area, I appreciate a rational, scientific discussion on the issue, rather than the emotive garbage spouted by a 16 year old et al. There are so many confounding factors – for example, Fort Denison could be gradually sinking under the weight of all that sandstone. The reactions to this alleged “end of the world” scenario are getting ridiculous, like people glueing themselves to tarred roads. Is that activity a result of climate change? As indicated in the article there are examples where people in the past have made bold predictions such as the Maldives being under water within 30 years. I would suggest that an organisation could collate all these catastrophic predictions and their non-outcomes and publish them in mainstream media at least once a year to debunk this “science”. For example, one could publish details of those who predict only 12 years left, and each year say “11 years remain to doomsday” ‘ “10 years remain to doomsday” and so on, until the big day arrives and nothing happens. All the ratbag activist groups are on the bandwagon, blaming “climate change” for their pet hates. One is the veganistas blaming meat producing animals for climate catastrophy (CO2?? I thought animals were mainly a source of methane) and therefore we should stop eating meat so as to save the planet. Next we will see a defendant in a court case blaming CO2 for criminal behaviour!! What next with this madness?
> ” … collate all these catastrophic predictions and their non-outcomes and publish them in mainstream media at least once a year …”
Such collations are indeed occurring. For example:
http://www.whatreallyhappened.com/WRHARTICLES/globalwarming2.html
There are quite a few sites like this. However, published in the MSM ? Not a hope.
Good essay, Jack Weatherall. The only improbable note for me is the hope that one’s own children will take notice of rational discussion and not the “consensus” din.
The Retraction Watch website is edifying for the number of medically-related flim-flams. Again, this meticulously collected list of destruction is never referred to in MSM publications or broadcasts; the most egregious may occasionally be given a guernsey in some Gee-Whiz article.
Spelling alert (who cares?) – “Catastrophy”?? Quelle catastrophe. Senility setting in.
Great stuff, Jack.
The entire CAGW meme is phony malarkey from beginning to end.
What is ‘global warming’ supposed to be? If one takes a look at the oldest temperature record in the world (the Central England Temperature” the “warming” is a dead straight line from 1659.
What is “Greenland ice loss supposed to represent? Take a look at the ice loss balance for Greenland for the last century and it is a dead straight line.
What is the definition of “climate change” anyhow? What is it supposed to represent? In order to delineate change, some metric is necessary. “Climate” is quantified by a classification system. The concept of “climate” is intended to allow the comparison of weather in one region with another. Try to find any region whose climate classification has significantly changed since. 1890. It’s just like finding significant sea level rise.
Open a beer and watch the CO2 escape as it warms up. That is Hook’s Law in action. Consider over 70% of the planet’s surface covered in water, and 340 times as much CO2 in the water as in the air, and it not difficult to see that mere humans cannot change that ratio. Contemplate the geologic record that clearly indicates a change in temperature preceding a change in atmospheric CO2, and the fact that temperature drives CO2 and not visa versa is staring you in the face.
“Climate change” is real. It is real mass hysteria. It is the most mendacious hoax played upon the human race since King James I published his seminal work “Daemonology” which lead to torture execution of thousands of innocent people as witches.
Thanks ianl for that hotlink. It certainly shows up the insanity of this climate change religious obsession.
What is a “climate scientist”? What is “climate science”?
Is there any other science discipline that proclaims it is unique?
Does it pertain to the atmosphere of the weather.No. That would be an atmospheric physicist or a meteorologist. How many STEM disciplines relate to weather past present and future? Dozens, such as geology, paleontology, physics, chemistry, astronomy, statistics. There are dozens. How many of these topics is studied by the activists that are climate alarmists? None.
This all began with the term “rocket science”. In order to design the machinery, the trajectories, and the astrophysics to successfully launch rockets, a myriad of disciplines in science and Engineering are necessary. But in the 1960’s the colloquialism “rocket scientist” was invented to suggest superior intelligence or something. It was, like, COOL, man. The climate hoax simply hitched itself to that wagon with the simplistic nonsense “climate science”.
For those interested in the facts, you can’t beat Tony Heller. Just type his name in on YouTube.
As someone who has been checking sea levels at my back door since 1946 and notes that current king tides are lower than then and that current mean sea level at Fort Dennison is lower than 1914 I know that satellite altimetry is just an algorithm based on assumption [remember when Envisat showed sea level fall until it was conveniently adjusted?] and sea levels are going nowhere.
And if sea levels are not rising our climate crisis is not happening.
Anyway, catastrophic anthropogenic global warming cannot possibly be occurring, because if it was, it would be bad for established business. And particularly for the coal business.