 Sign In
 0 Items (
 Search


UPDATE 26 May 2010: Paul Fraser, the Chief Research Scientist at CSIRO, has responded to Tom Quirk here…
Postscript to The Unfinished Hockey Stick
Sometime after the posting of my essay on May 19, a funny thing happened on the CSIRO website. There was a change to page 5 of the “State of the Climate” report by the CSIRO. This has the appearance of a response.
The comparison is shown in Figure 1 where on the left the original may be compared to the altered figure with the footnote "updated May 2010" added on the right.
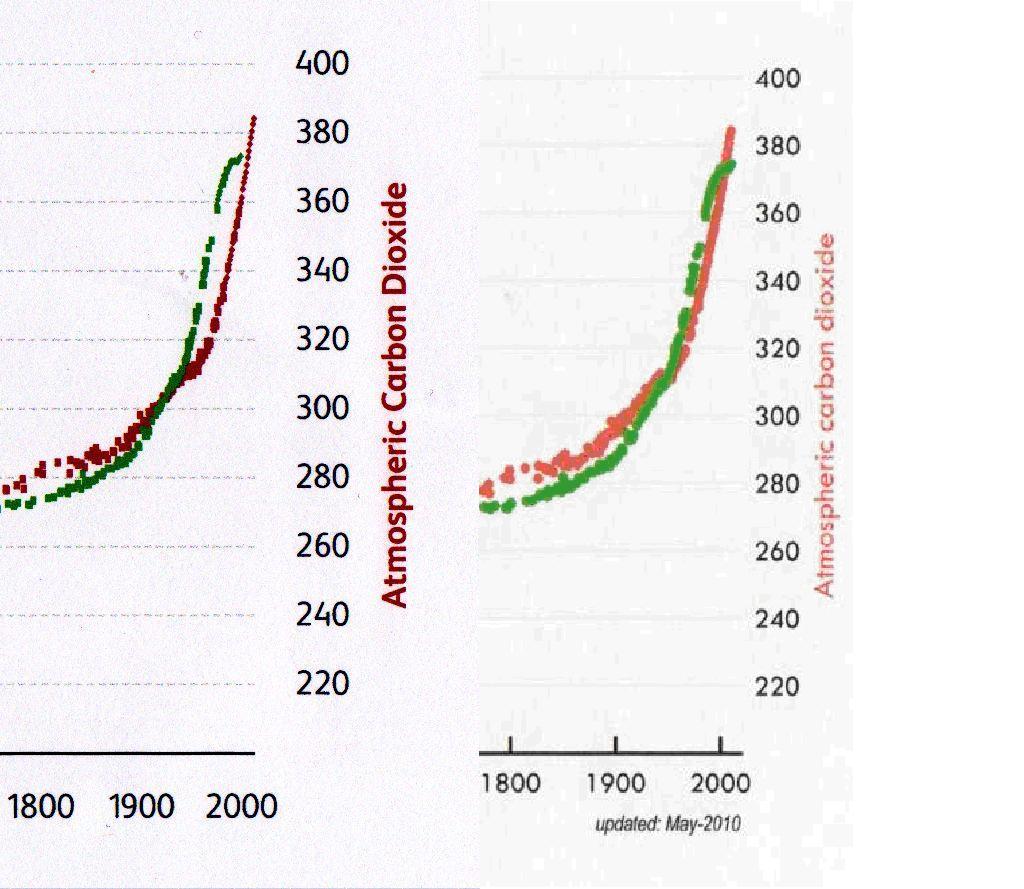
Figure 1:
Carbon dioxide (parts per million) and methane (parts per billion) concentrations measured in ice cores and directly in the atmosphere.
Left Original State of the Climate, Right May 2010 version State of the Climate.
While this now appears to be an attempt to present consistent data the CSIRO is not addressing the issue of a straight forward presentation of the available measurements.
The last twenty years of action have been compressed by the choice of timescale into an unreadable format.
This selective presentation is compounded by the following figure on Page 5 of "State of the Climate" (Fig. 2) that shows the rise in carbon dioxide at Cape Grim on the coast of Tasmania.
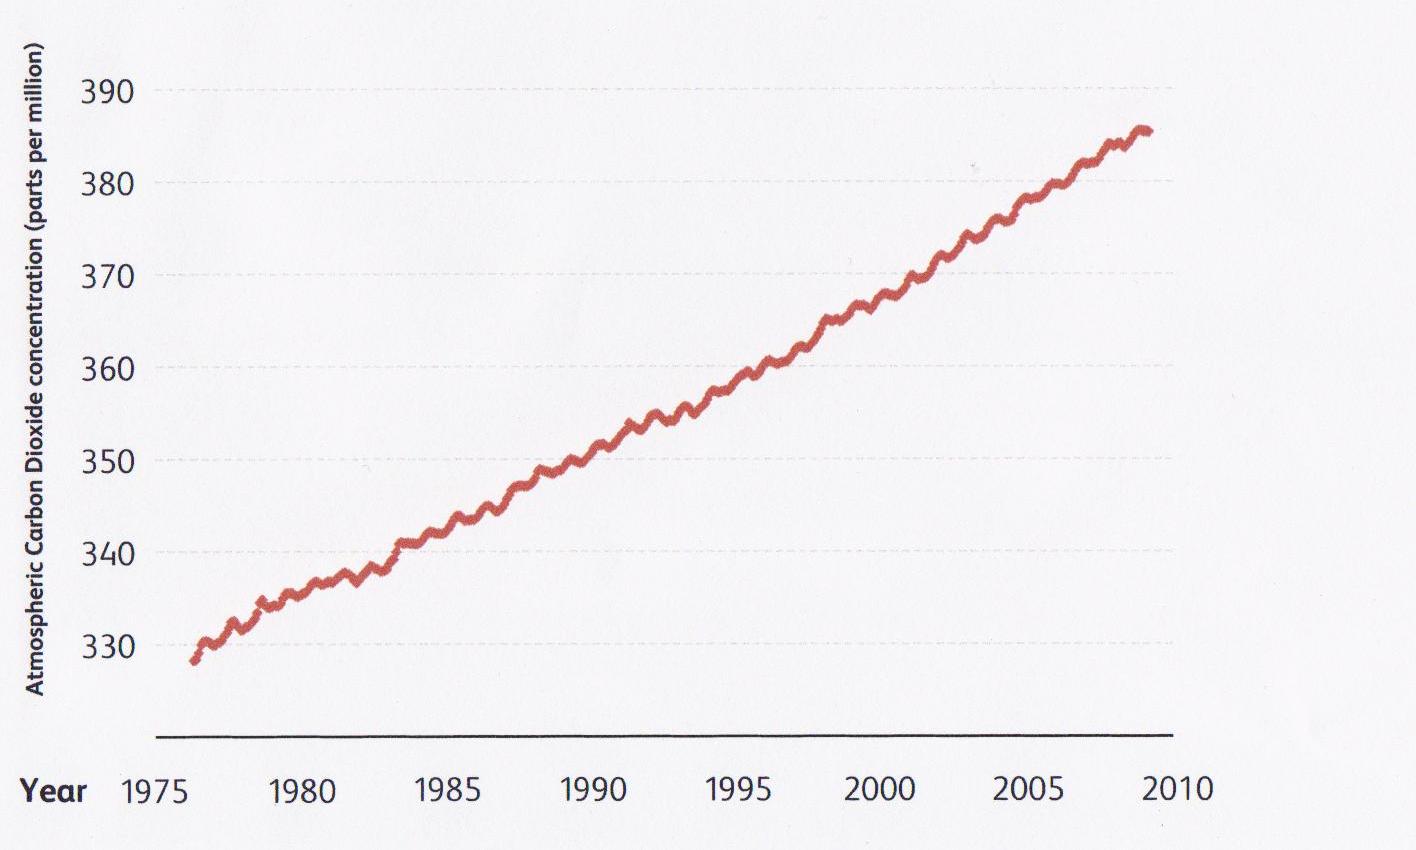
Figure 2:
Carbon Dioxide concentrations measured at Cape Grim Tasmania (Latitude 400 S)
Not shown in this figure are the measurements of methane recorded at the same time and available through the Carbon Dioxide Information Analysis Center. Carbon dioxide and methane measurements are compared in Figure 3 with carbon dioxide measurements from Baring Head in New Zealand (latitude 410 S) from the Scripps Institute of Oceanography.
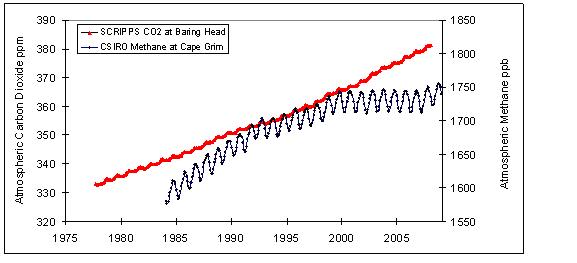
Figure 3:
Carbon Dioxide concentrations measured at Baring Head, New Zealand (Latitude 410 S) and methane concentration measured at Cape Grim, Tasmania (Latitude 400 S)
The unfortunate conclusion from this analysis is that the CSIRO has been highly selective in the presentation of data. Why the methane data from 1984 on was omitted from the second figure of page 5 of the "State of the Climate" report needs some explanation.
Lest anyone should claim that methane is on the rise again then the measurements of annual changes in methane suggest that it is too early to tell as the trend would indicate otherwise.
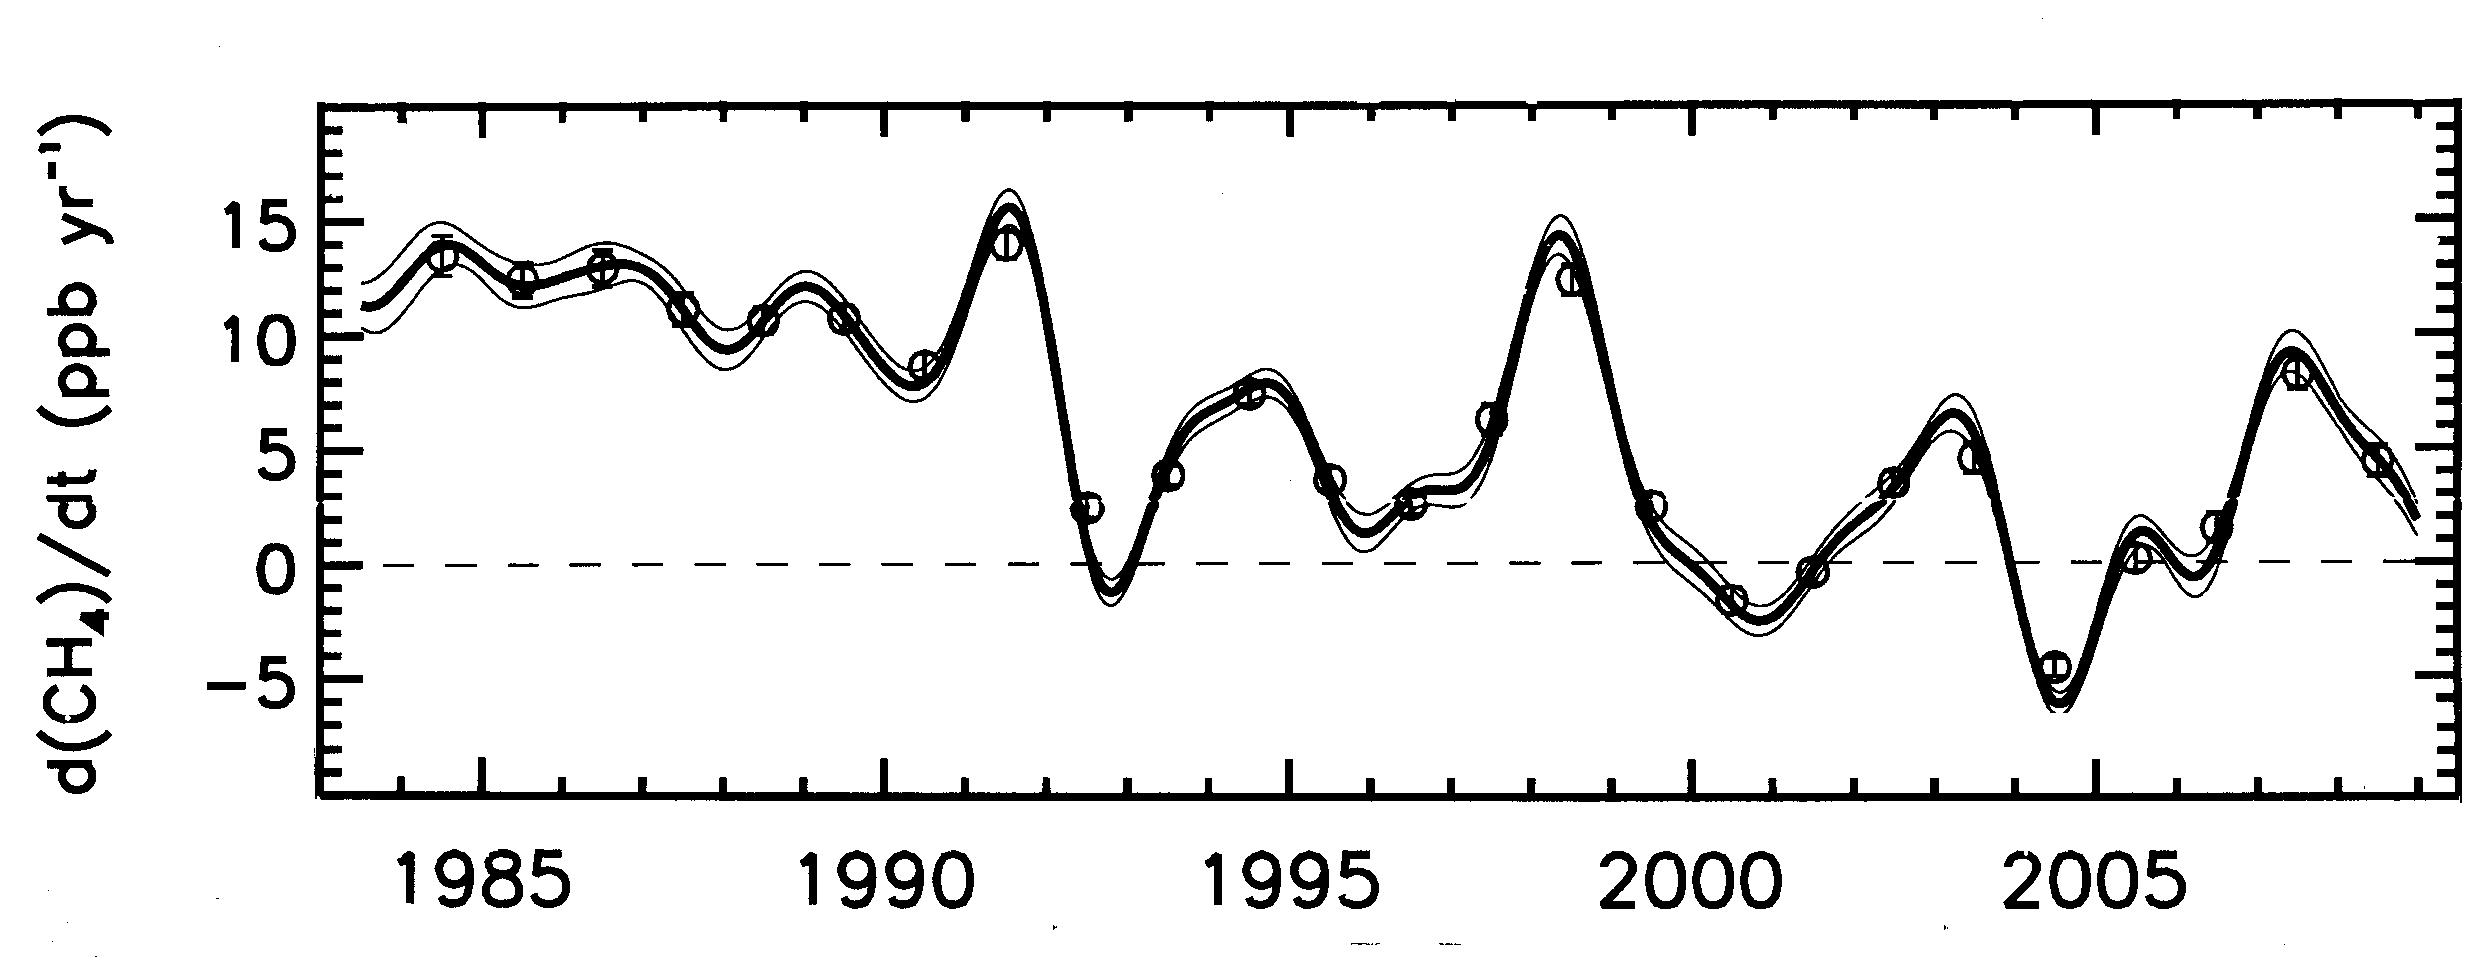
Figure 4:
Recent measurements of atmospheric methane[i]. Instantaneous growth rate for globally averaged atmospheric methane (solid line; dashed lines are ±1 standard deviation).
The CSIRO should be presenting the state of the climate and the state of the understanding of the climate. The IPCC reports that there is a lack of understanding for the behaviour of methane but our CSIRO expresses no opinion but rather chooses to ignore what may be inconvenient facts. This is not serving the community well. There are billions of dollars at risk for coal miners and farmers. To seek to regulate or penalize miners and farmers on the basis of poorly understood science and selective presentation will only serve to diminish the reputation of the CSIRO and is no help to policy makers.
[i] E. J. Dlugokencky, L. Bruhwiler, J. W. C. White, L. K. Emmons, P. C. Novelli, S. A. Montzka, K. A. Masarie, P. M. Lang, A. M. Crotwell, J. B. Miller and L. V. Gatti, Observational constraints on recent increases in the atmospheric CH4 burden. Geophysical Research Letters, 36, L18803, 2009
