 Sign In
 0 Items (
 Search


I respond to points raised in Joanne Nova’s piece Credibility lies with evidence.
 From JN’s statement: “And I’m quite consistent in saying that man-made warming is probably real but minor. I provided two references suggesting it is in the order of 0.5°C of warming instead of 3.5°C. Yes, CO2 causes warming, but how much”, it appears the differences in views regarding the reality and origin of global warming are of a quantitative nature rather than qualitative nature.
However, JN also states: “I want evidence that sheds light on the cause” (i.e. of global warming) and “the cause and effect link is most likely the reverse”. If I read the last statement correctly, JN questions whether it is CO2 which drives temperatures or the other way around?
Rising CO2, rising temperatures and melting ice are intertwined processes forming feedback loops, i.e. elevated CO2 causes warming and warming drives further CO2 release. The geological record displays episodes of Primary forcing by carbon release of CO2 from volcanoes or from carbon-rich sediments excavated by asteroid impacts, or release of methane from heated sediments, amplified by feedbacks, leading to mass extinction of species[1]. The release of some 370 billion tons of carbon as coal, oil and gas from rocks, where the carbon was locked for millions of years, constitutes primary radiative forcing, triggering a carbon cycle feedback loop amplified by ice melt/warm water interaction where albedo loss by melting ice is reinforced by infrared absorption by open water[2]. A prime example is the transformation of the Arctic Sea from a high albedo ice surface to infrared-absorbing open-water ocean, with effects on the Greenland ice cap and northern hemisphere climate.
Quantitative relations between CO2 and temperature are defined by the “climate sensitivity” index (T rise per doubling of CO2 concentration)[3], estimated at about 3+/-1.5C but stronger during glacial periods. The current CO2 level at 389 ppm is the highest since 2.8 million years ago (mid-Pliocene), when temperatures rose by 3-4 degrees C and sea levels by 25+/-12 meters [4],[5]. The occurrence of thousands of billion tons of carbon as meta-stable methane deposits in permafrost, Arctic lakes and bogs poses a serious risk associated with polar warming, currently up to 4 degrees C[6]. The emission of some 370 billion tons of carbon (GtC) since 1750 constitutes near-20% of the carbon released as methane during the Paleocene-Eocene Thermal Maximum 55 Ma ago, which raised global temperatures by near 5 degrees C[7].
Paleo-climate records indicate high temperatures and high CO2 levels of several thousand ppm during much of the early Paleozoic (540–350 Ma), a period of low solar luminosity[8]. Levels of greenhouse gases and temperature display an overall but highly intermittent decline with time whereas, by contrast, solar luminosity has been rising, negating a long-term correlation between the sun and global temperatures. It is when CO2 levels declined to below c.500 ppm that the Antarctic ice sheet formed. Conversely, the rise of CO2 above this level would melt the great ice sheets. Abrupt increases in CO2 leading to sharp warming episodes were associated with mass extinction of species [9]. The current CO2 rise rate of c.2 ppm/year, unprecedented in geological history (excepting major volcanic and impact events), is a cause for concern.
JN states: “warming started a century before our carbon emissions began to rise”.
The study of multiple proxies, including oxygen isotopes from ice cores, lake and cave deposits, Ca/Mg ratios, 13C and alkenone (organic remnants), tree rings and sapropel (carbon-rich soil), display consistent paleo-temperature trends (Figure 1). The data indicate long-term cooling since about 4-5 thousand years ago, a rise of about c.0.5 degrees C during c.950-1050 AD (Medieval Warm Period – MWP), a decline by a similar amount to 1600-1700 AD (Little Ice Age) related to near-nil sunspot activity, then a rise by more than 1 degree C to a level which exceeds the MWP by near-0.5 degrees C. Only 0.12 Watt/m2 of warming since 1750 AD is attributed to the solar factor.[10]
JN states: “If the “hot spot” is missing and feedback is negative, almost everything else is irrelevant”.
As indicated in Figure 2[11], 1957-2005 warming of the surface (c.0.5-0.6 degrees C), of the lower troposphere (c.0.3-0.4C) and of mid to upper troposphere, and cooling of the stratosphere, expected from the greenhouse infrared backscatter effect, are consistent with a rise in mean global temperatures, perturbed by the aerosol effects of volcanic eruptions.[12]
Figures:
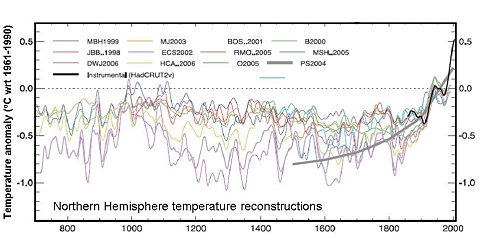
Figure 1.
IPCC 2007 Chapter 6. Records of Northern Hemisphere temperature variation during the last 1.3 kyr. Reconstructions using multiple climate proxy records identified in Table 6.1, including three records (JBB.1998, MBH..1999 and BOS..2001) shown in the Third Assessment Report and the HadCRUT2v instrumental temperature record in black. All temperatures represent anomalies (°C) from the 1961 to 1990 mean.
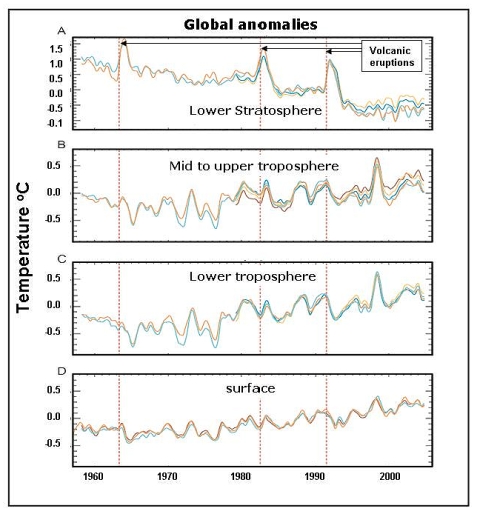
Figure 2.
Observed surface and upper-air temperature anomalies (°C). (A) Lower stratosphere T4, (B) Troposphere T2, (C) Lower troposphere T2LT from UAH, RSS and VG2 MSU satellite analyses, and UKMO HadAT2 and NOAA RATPAC radiosonde records, and (D) surface records from NOAA, NASA-GISS and UKMO/CRU (HadCRUT2v). All time series are monthly mean anomalies relative to the period 1979 to 1997 smoothed with a seven month running mean filter. Major volcanic eruptions are indicated by vertical orange dashed lines.
[1] Ward (2005), Keller (2005).
[2] Hansen et al. (2007, 2008).
[3] Charney (1979).
[4] Pagani et al. 2010.
[5] Haywood and Williams (2005), Dowsett (2007), Robinson et al (2008), chandler et al (2008)
[6] http://data.giss.nasa.gov/gistemp/
[7] Zachos et al. (2008).
[8] Royer (2001, 2004, 2008); Beerling et al. (2001); Berner (2005) and references therein (http://droyer.web.wesleyan.edu/GSA_Today.pdf). See figure 2 in https://quadrant.org.au/blogs/doomed-planet/2010/04/andrew-glikson
[9] Ward, 2005; Keller, 2005; Zachos et al., 2008
[10] IPCC AR4-2007
[11] Adapted from Karl et al., (2006); IPCC (2007) Figure 3.17. Department of Climate Change: Science – facts and fiction. (http://www.climatechange.gov.au/en/climate-change/science.aspx)
[12]Adapted from Karl et al., (2006); IPCC (2007) Figure 3.17. (http://www.climatechange.gov.au/en/climate-change/science.aspx)
